Traffic Replay Test
Traffic Replay Test allows you to capture live HTTP traffic and re-use it for testing your application.
Record application
AREX Agent is the core component for recording and replay, and configuration of the Agent is required in the application under test before using the recording function.
After the configuration is completed, access the AREX frontend page through a browser, click Replay, and the configured application under test can be seen in the left sidebar.
By default, after the application is deployed with Agent, AREX will automatically start recording the online real request traffic during all time periods of the application. You can also set the recording task according to your needs through the app setting.
View Recorded cases
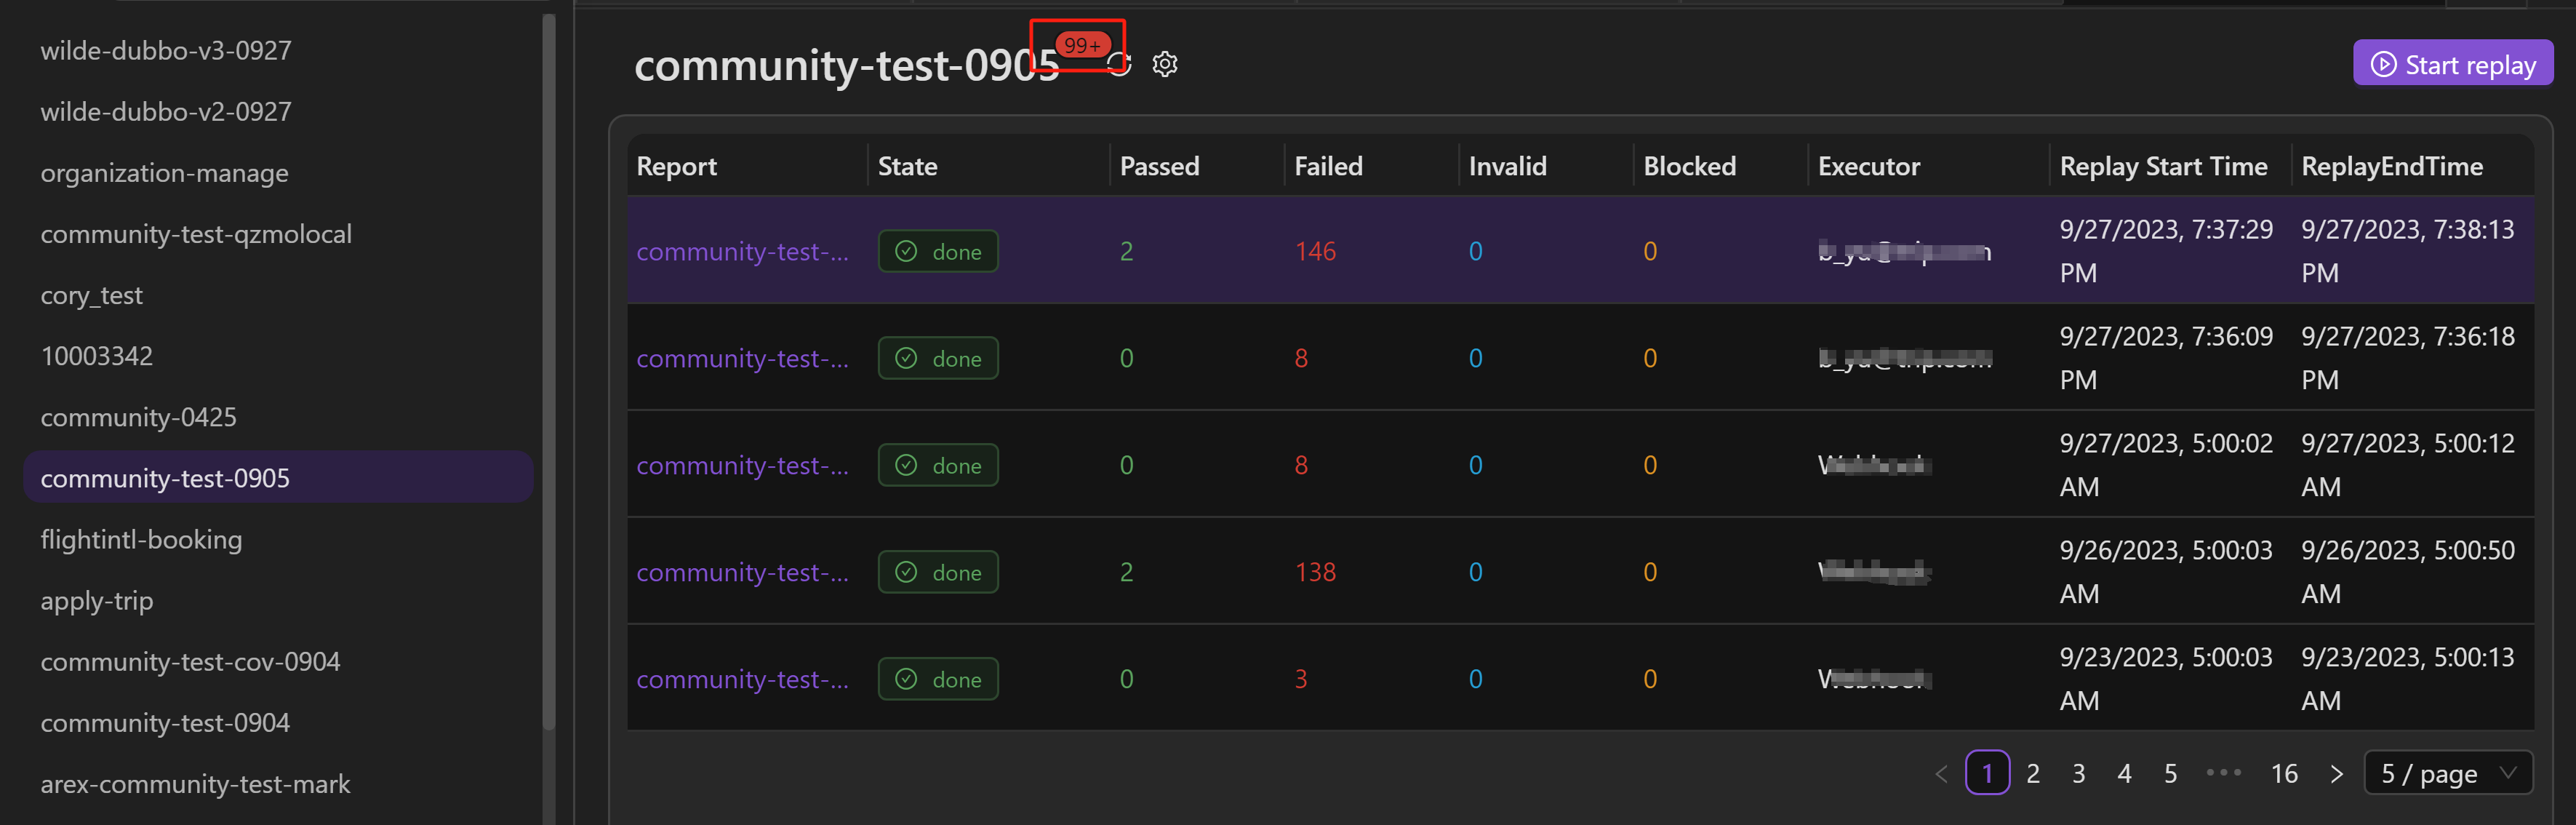
After the application generates request traffic and is recorded, you can view the recording details above the replay report list.
The database only stores recorded cases within the last 4 days by default, and expired cases will be automatically deleted. If you need to keep them for a longer time, just add a configuration item in the arex-storage-service of the docker-compose.yml.
arex-storage-service:
...
    environment:
      - TZ=Asia/Shanghai
      - JAVA_OPTS=-Darex.storage.mongo.host=mongodb://arex:iLoveArex@mongodb:27017/arex_storage_db
        -Darex.storage.cache.url=redis://redis:6379/
        -Darex.report.service.api=http://arex-report-service:8080
        -Darex.storage.defaultExpirationDuration=1000000000
...
Only takes effect after modifying the configuration and restarting AREX.
All recorded interfaces are listed below, and clicking on an interface will display all the test cases that were recorded for that interface.
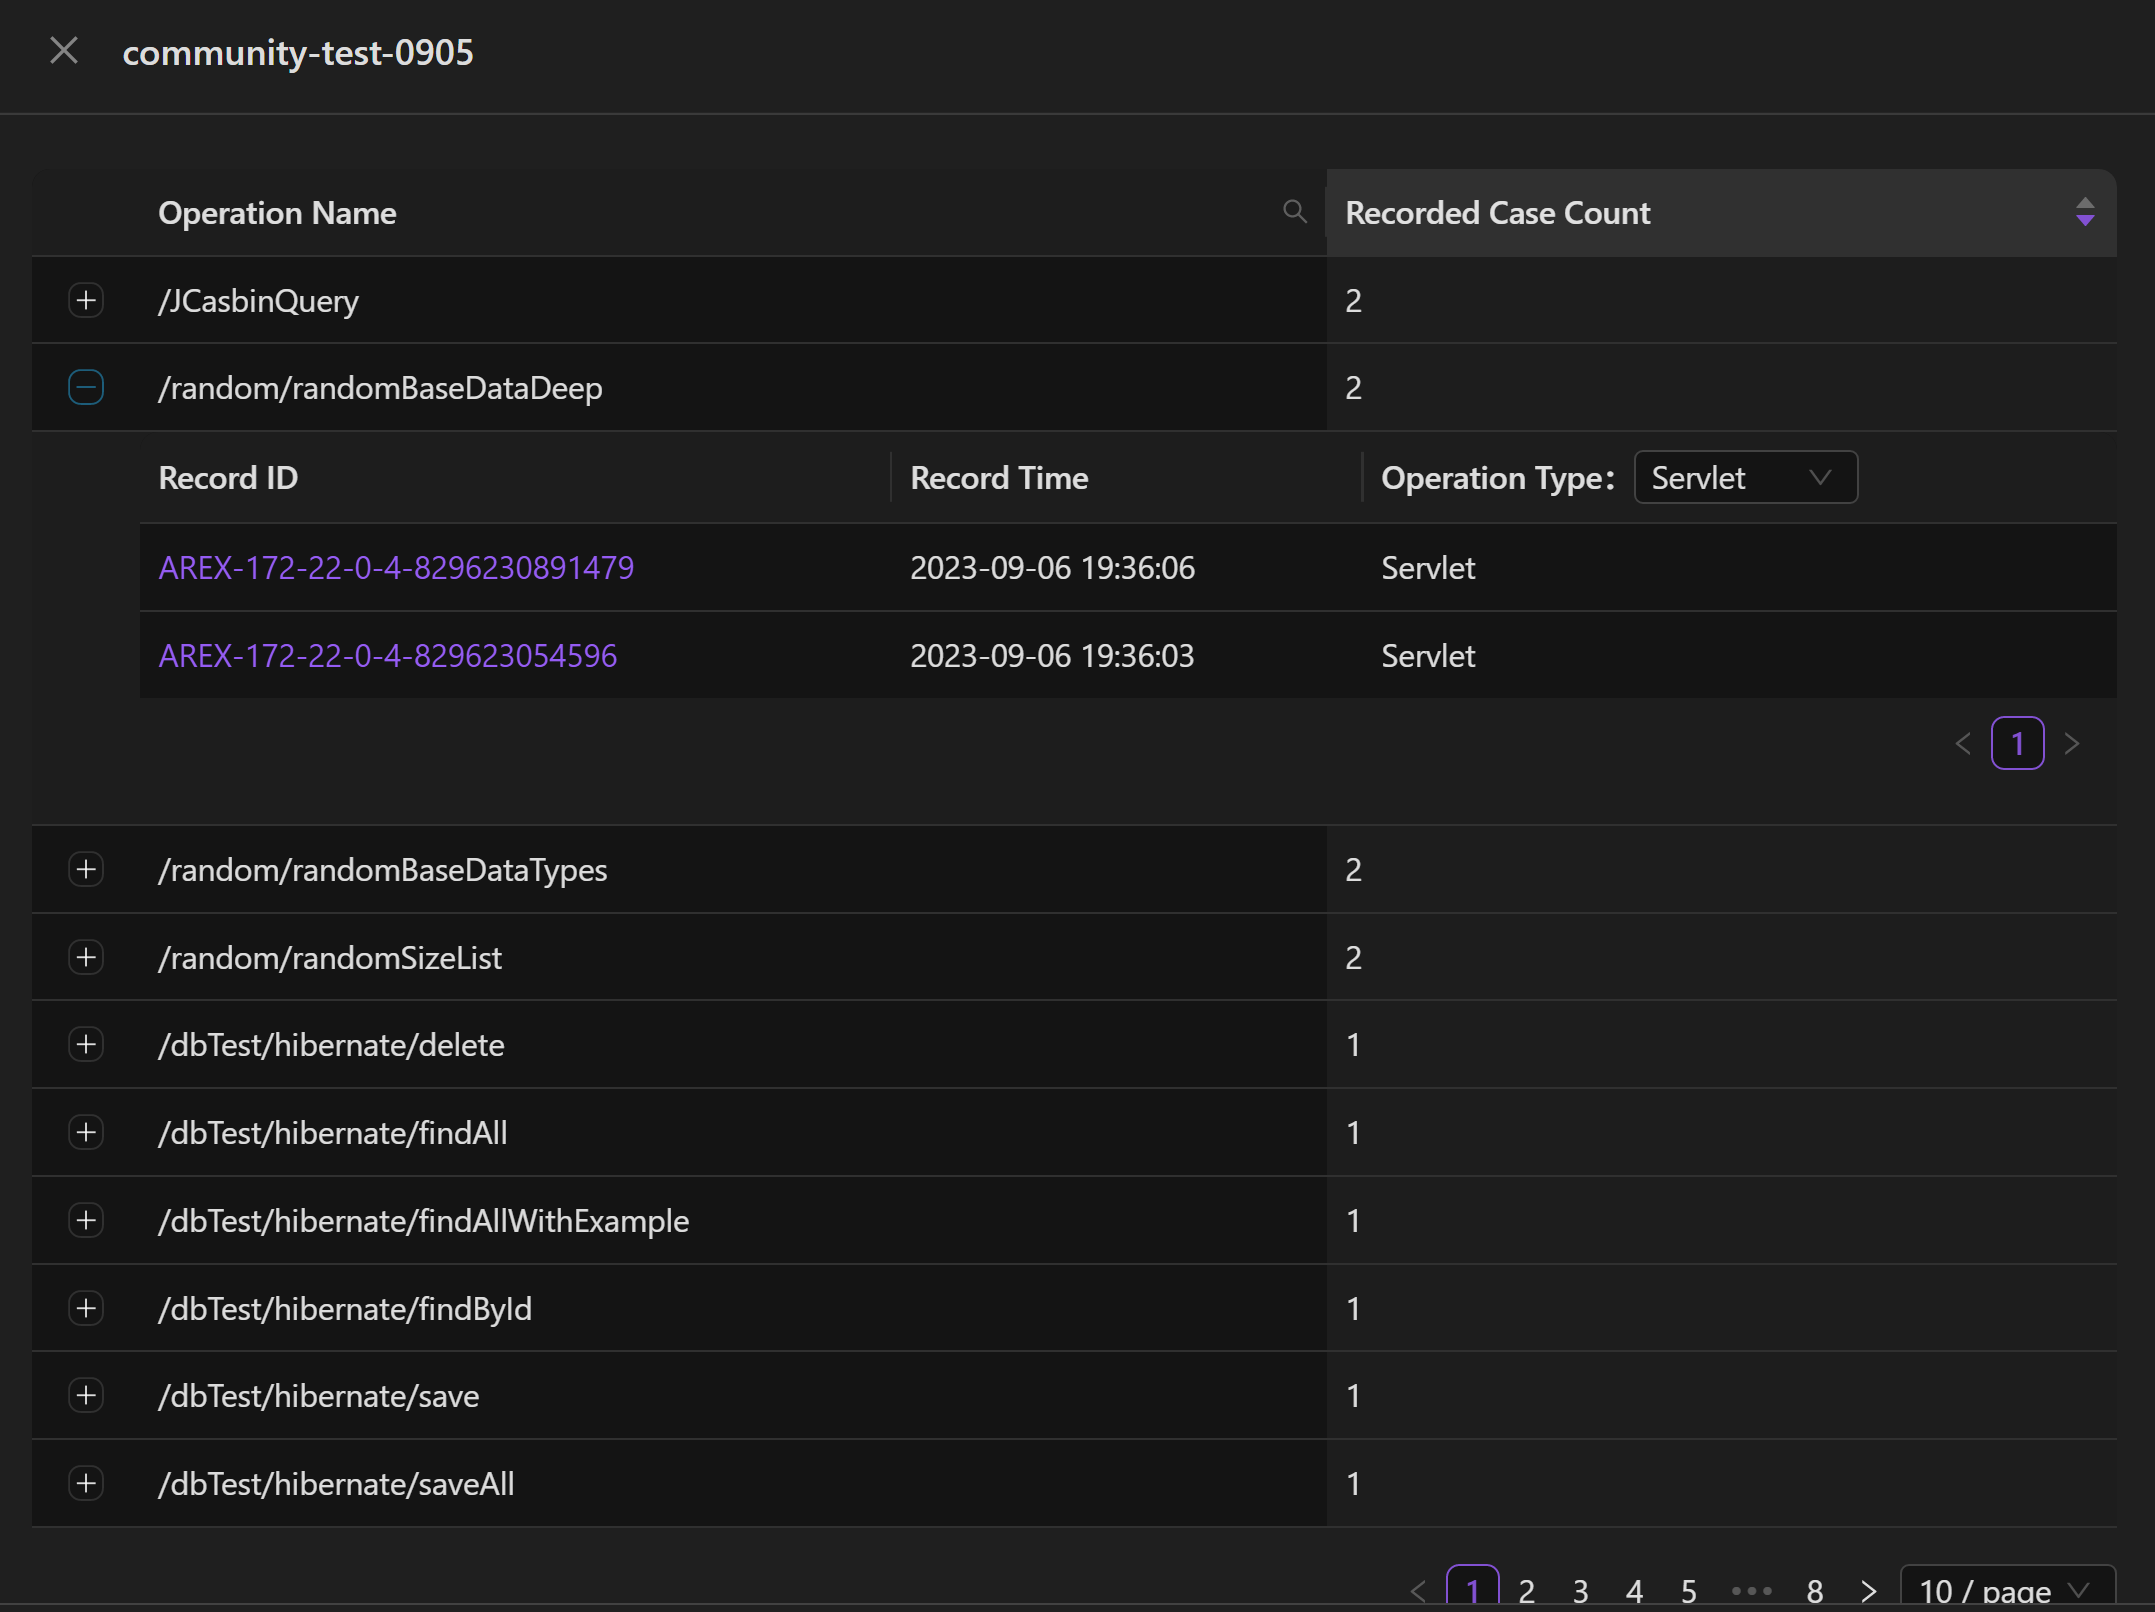
Clicking on a test case will display the recording details for that test case.
On the left side, you can see the request content of dynamic classes and external calls to third-party dependencies (such as databases) during the recording process, as well as the request of the main interface. On the right side, you can see the corresponding response.
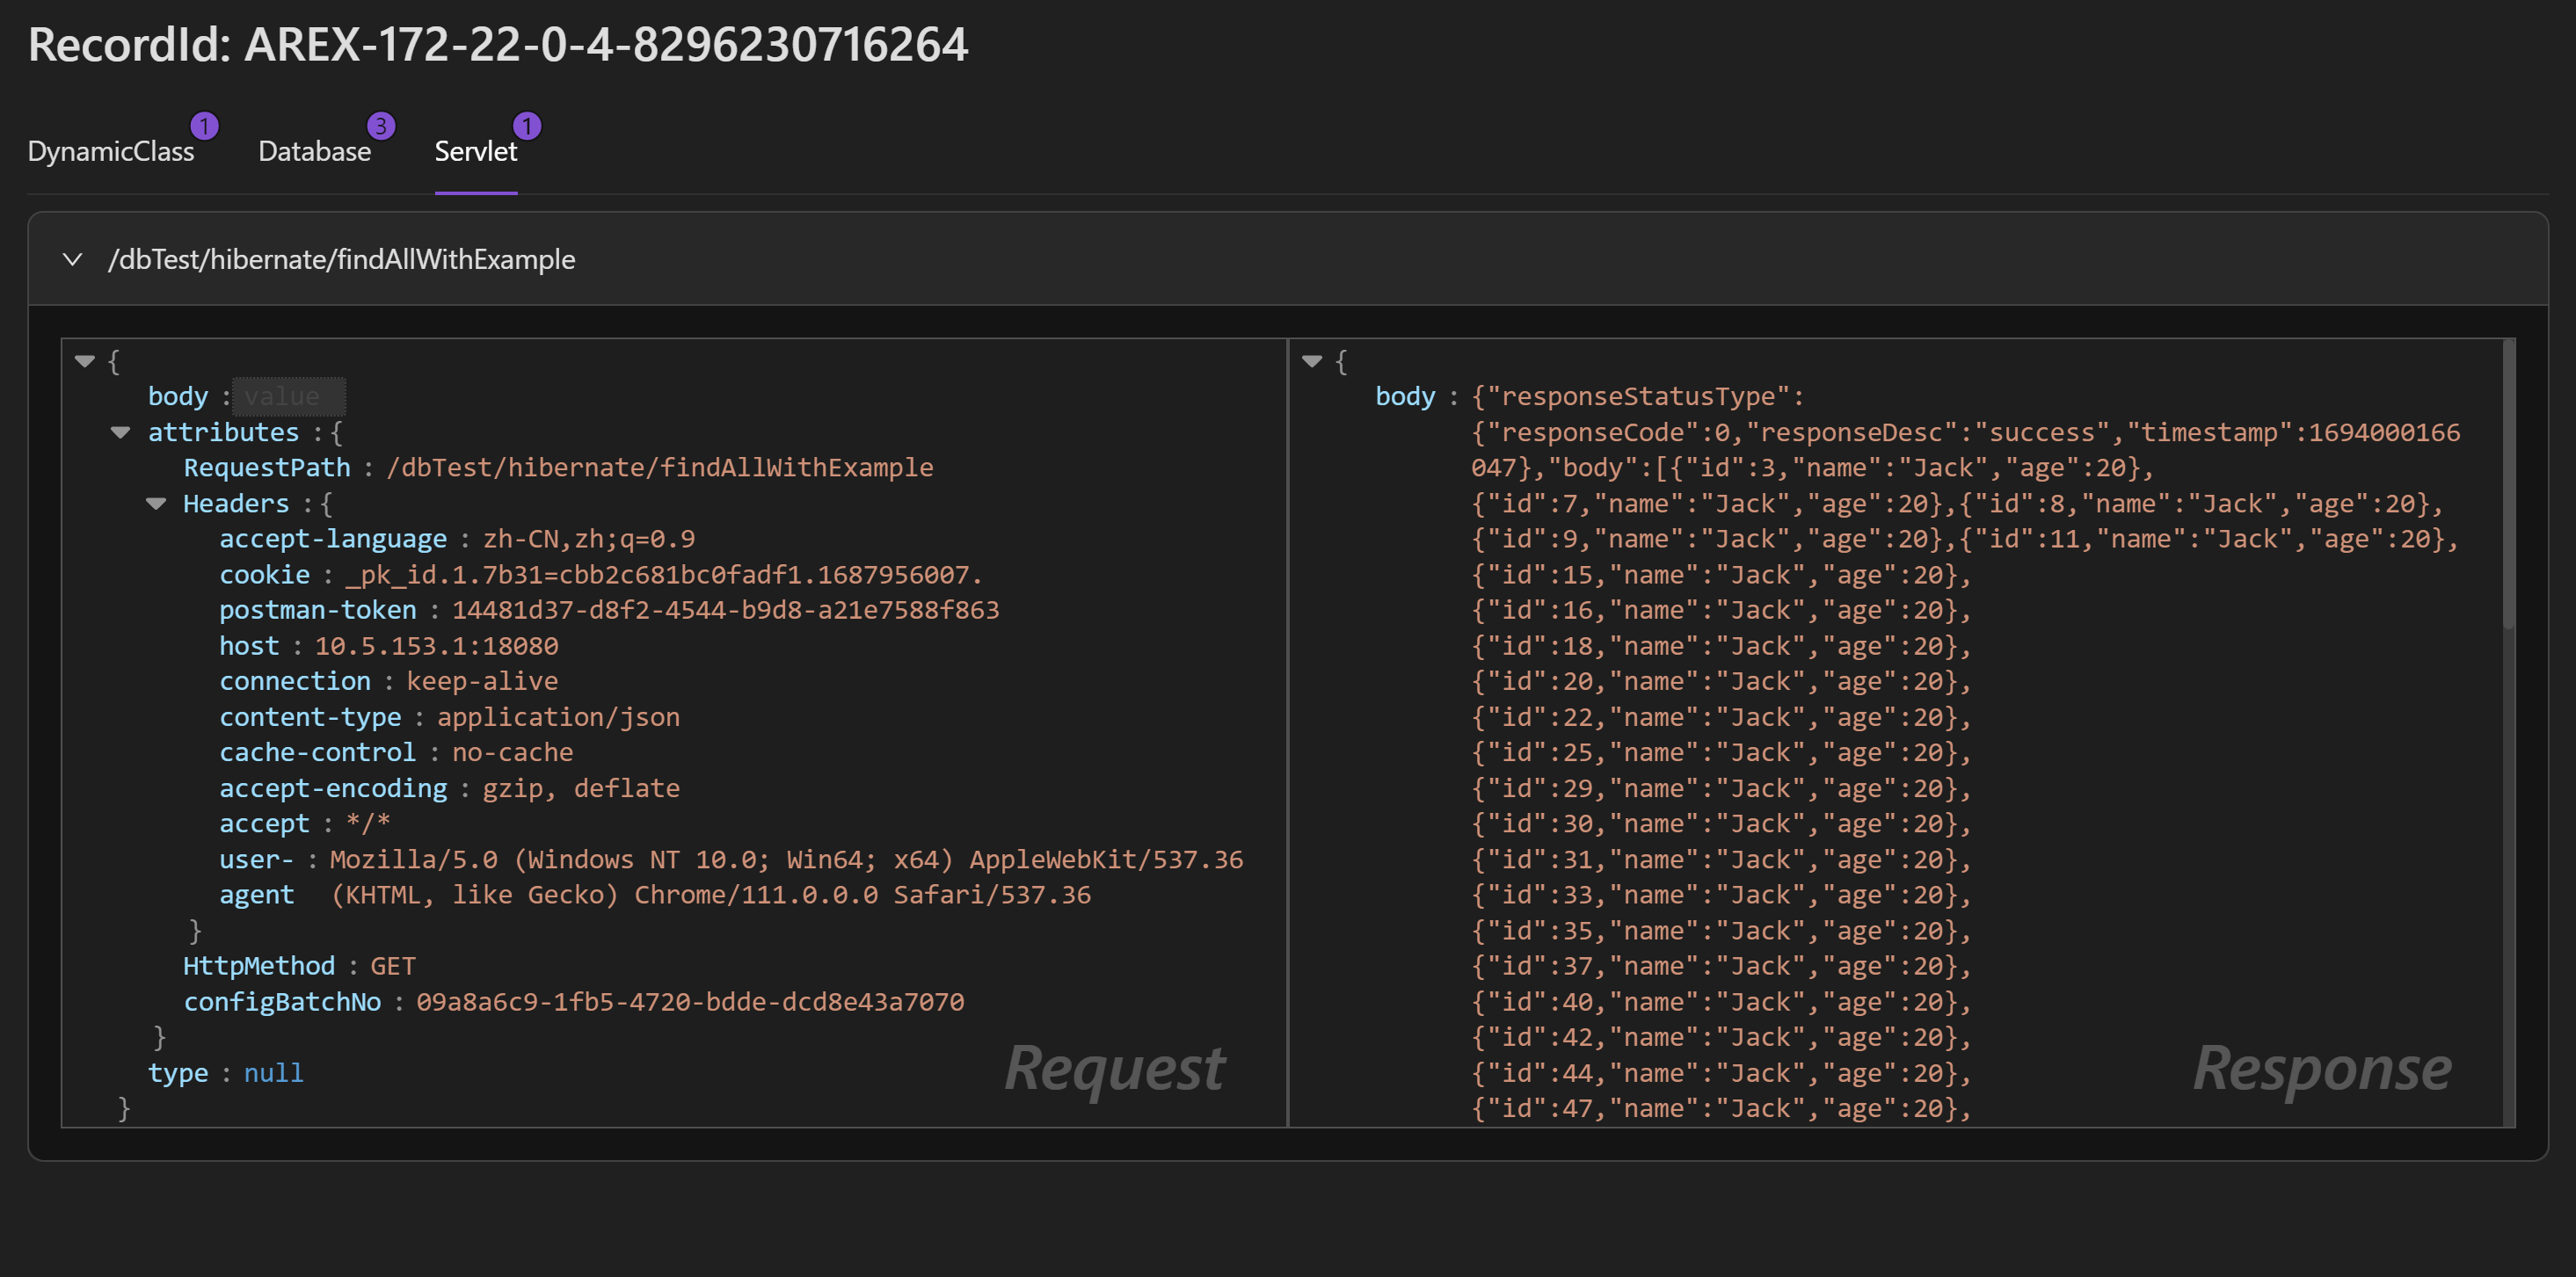
Some of the recorded request/response bodies are in a compressed format using base64 encoding, so you will need to decode them in order to view the contents.
Some recorded request/response bodies are compressed in base64 format and need to be manually decompressed to view.
Start replay
Once the application is set up, you are ready to replay recorded traffic to test.
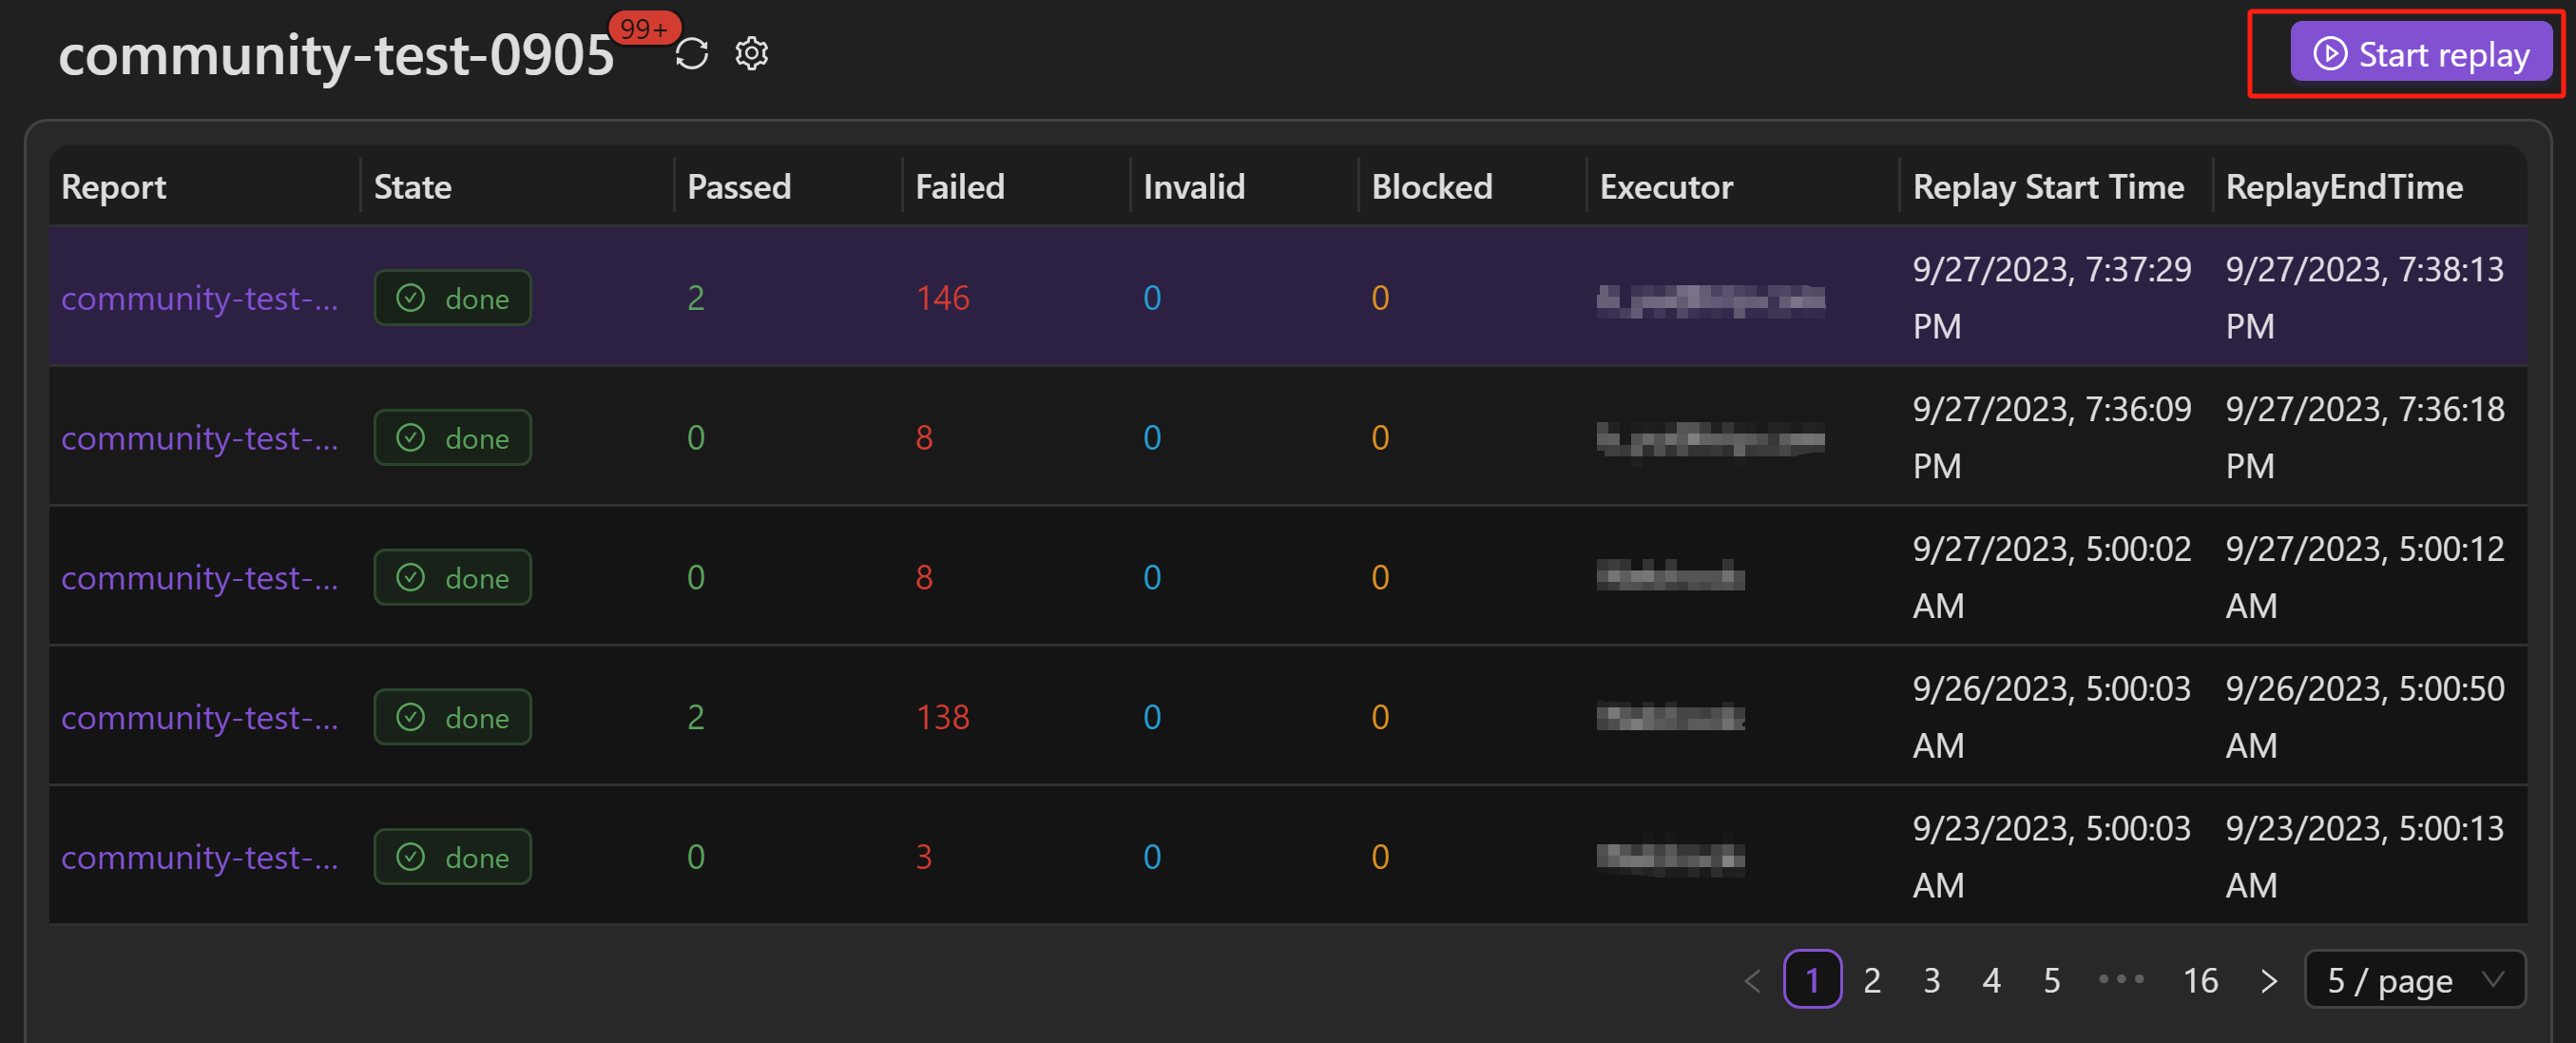
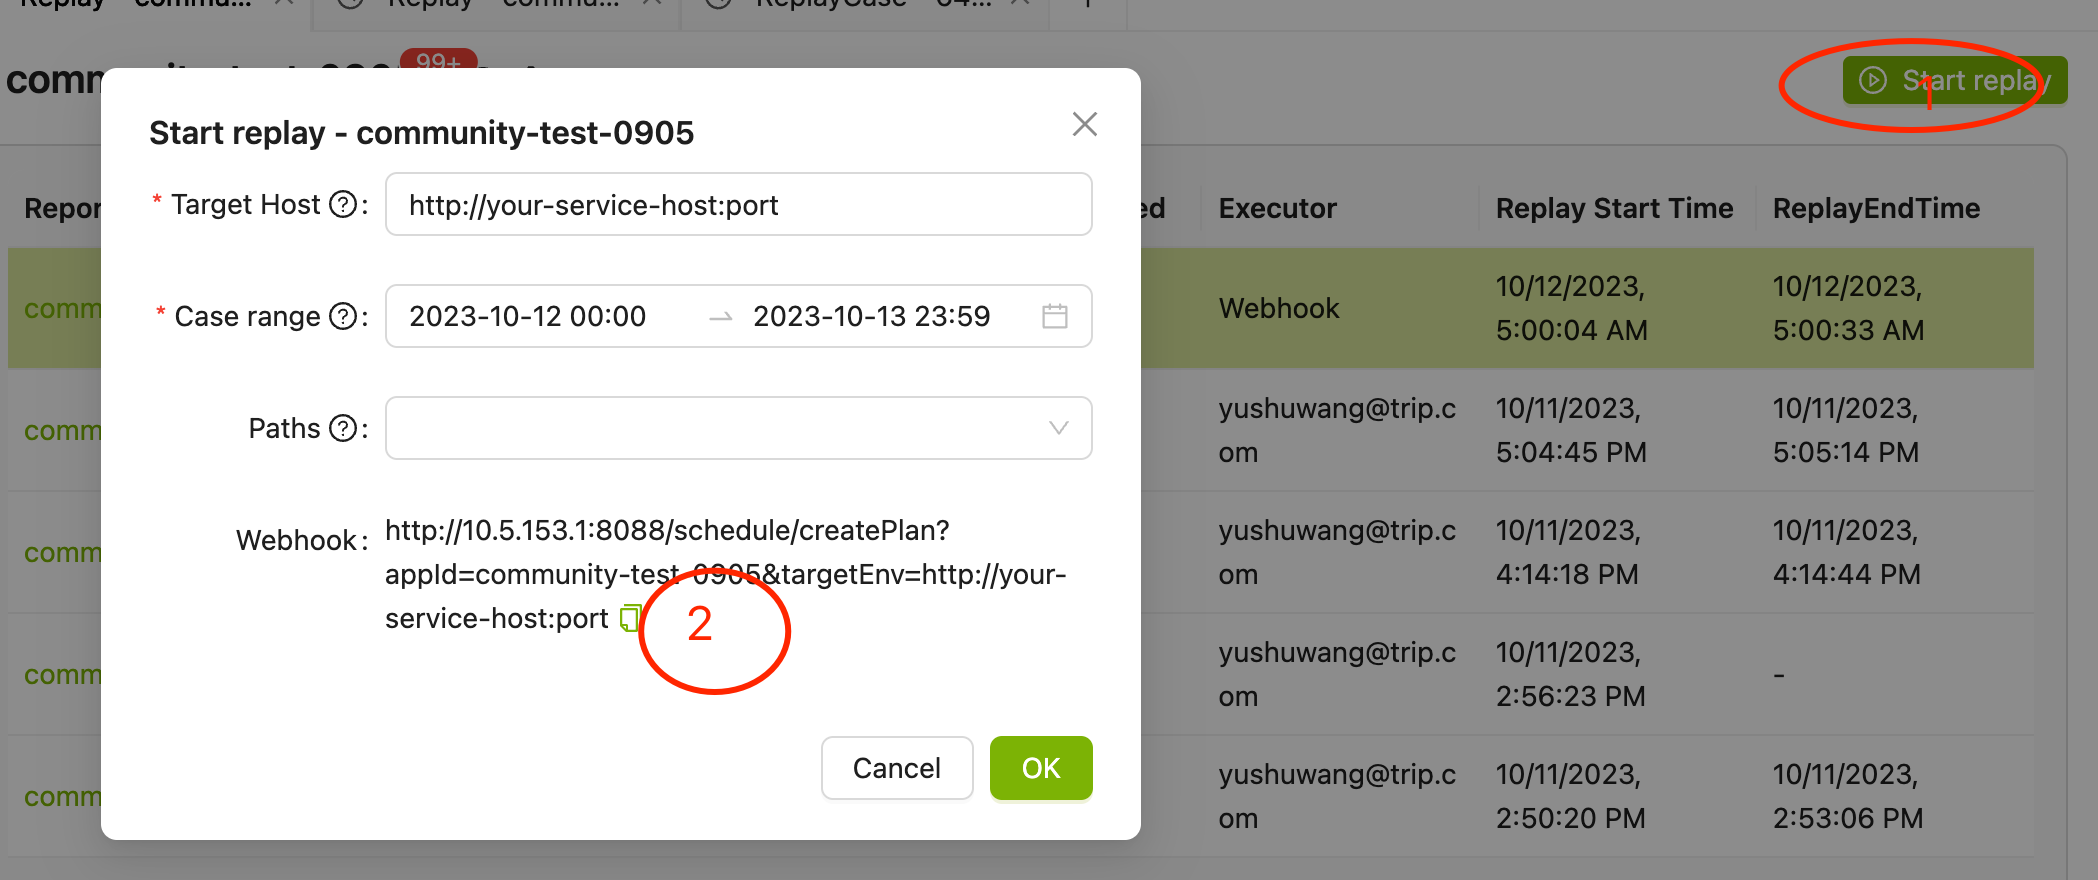
Select the application which you are working with. The workspace displays previous replay lists. To begin the replay task, select "Start Replay" in the top right corner.
Enter the host that you want to test in the local/test environment in the Target Host field, and then specify the start and end time for replaying the recorded cases within this timeframe.
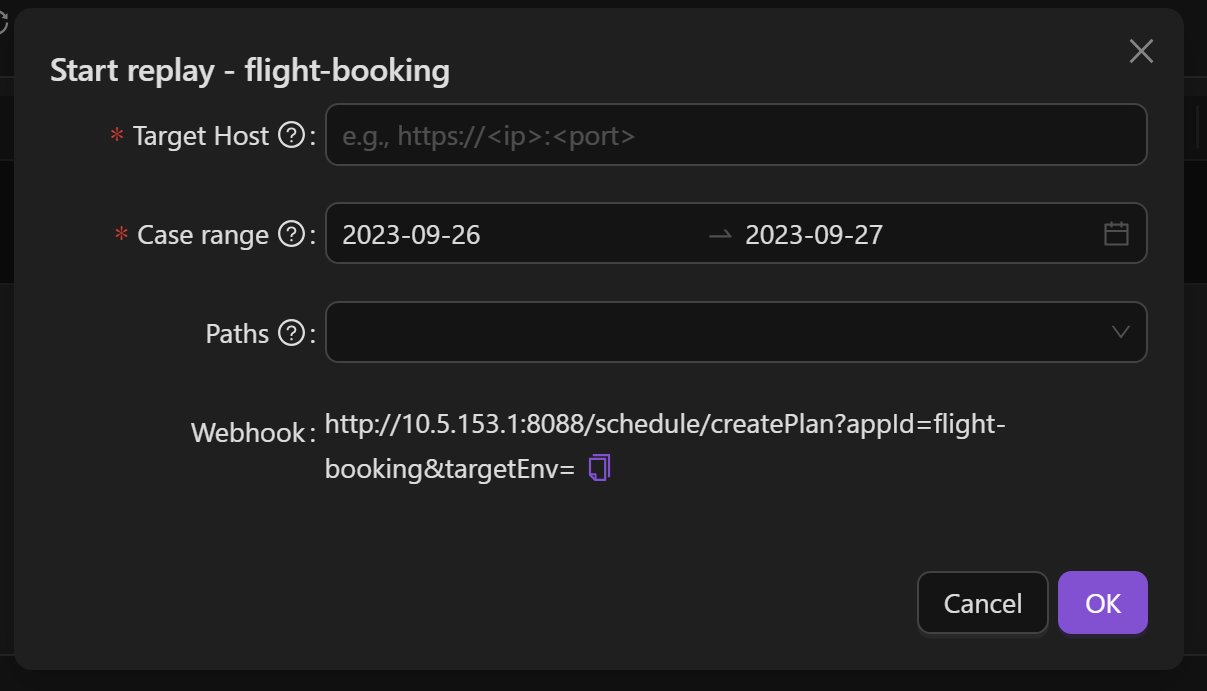
It is not recommended to replay in production environments. Generally, production environments only record traffic and replay in test environments or local operations.
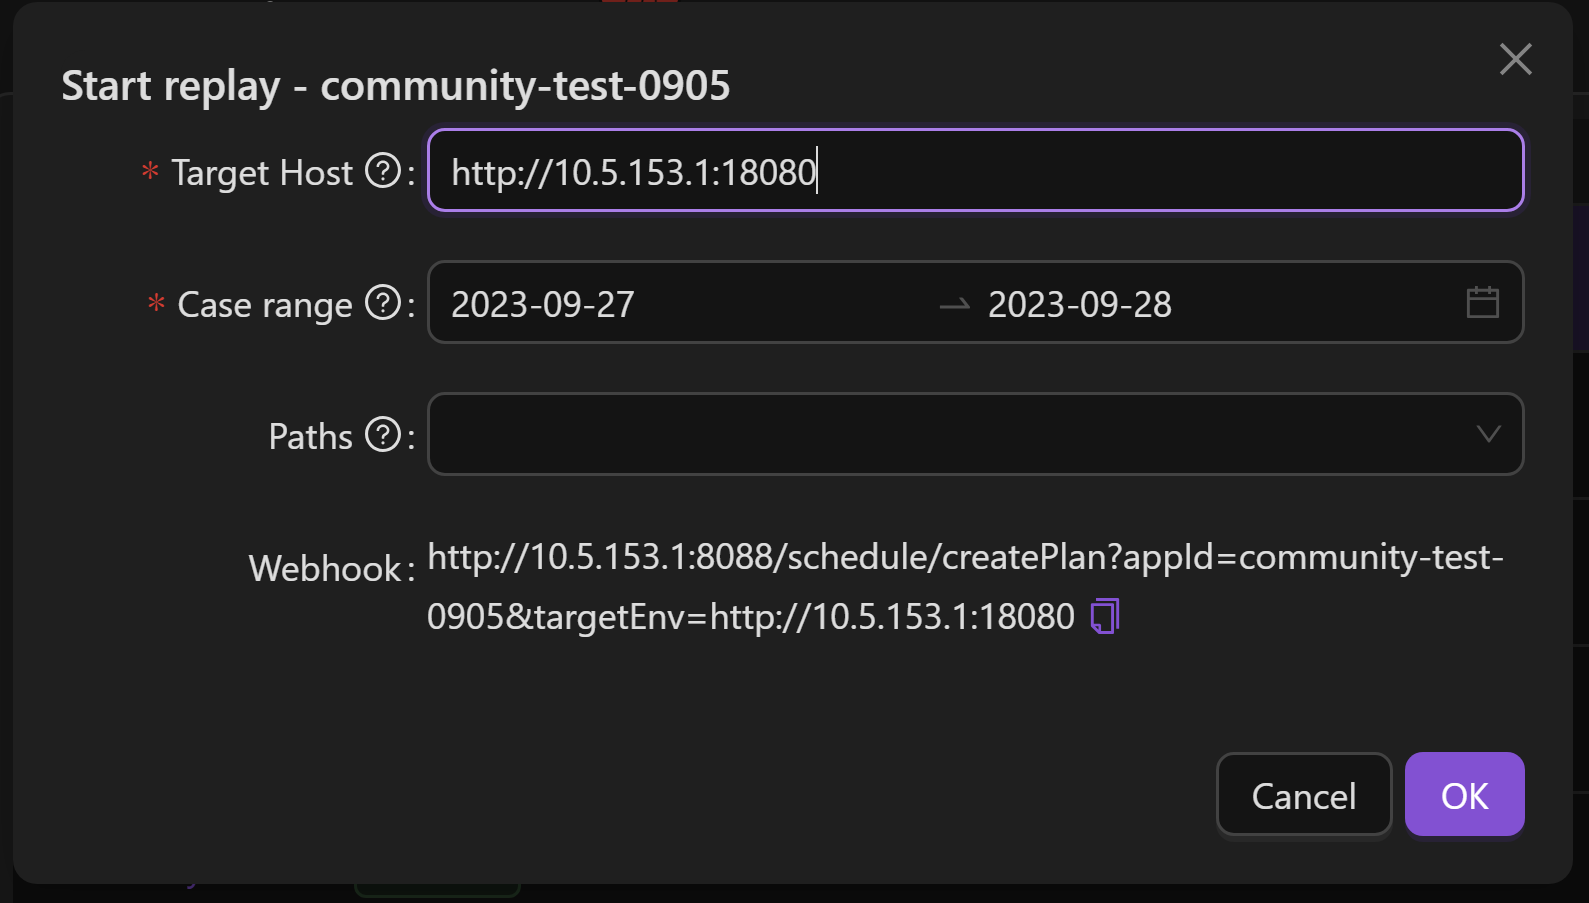
The complete Target Host should be protocol + domain + port number (the default port 80 also needs to be entered manually), as follows:
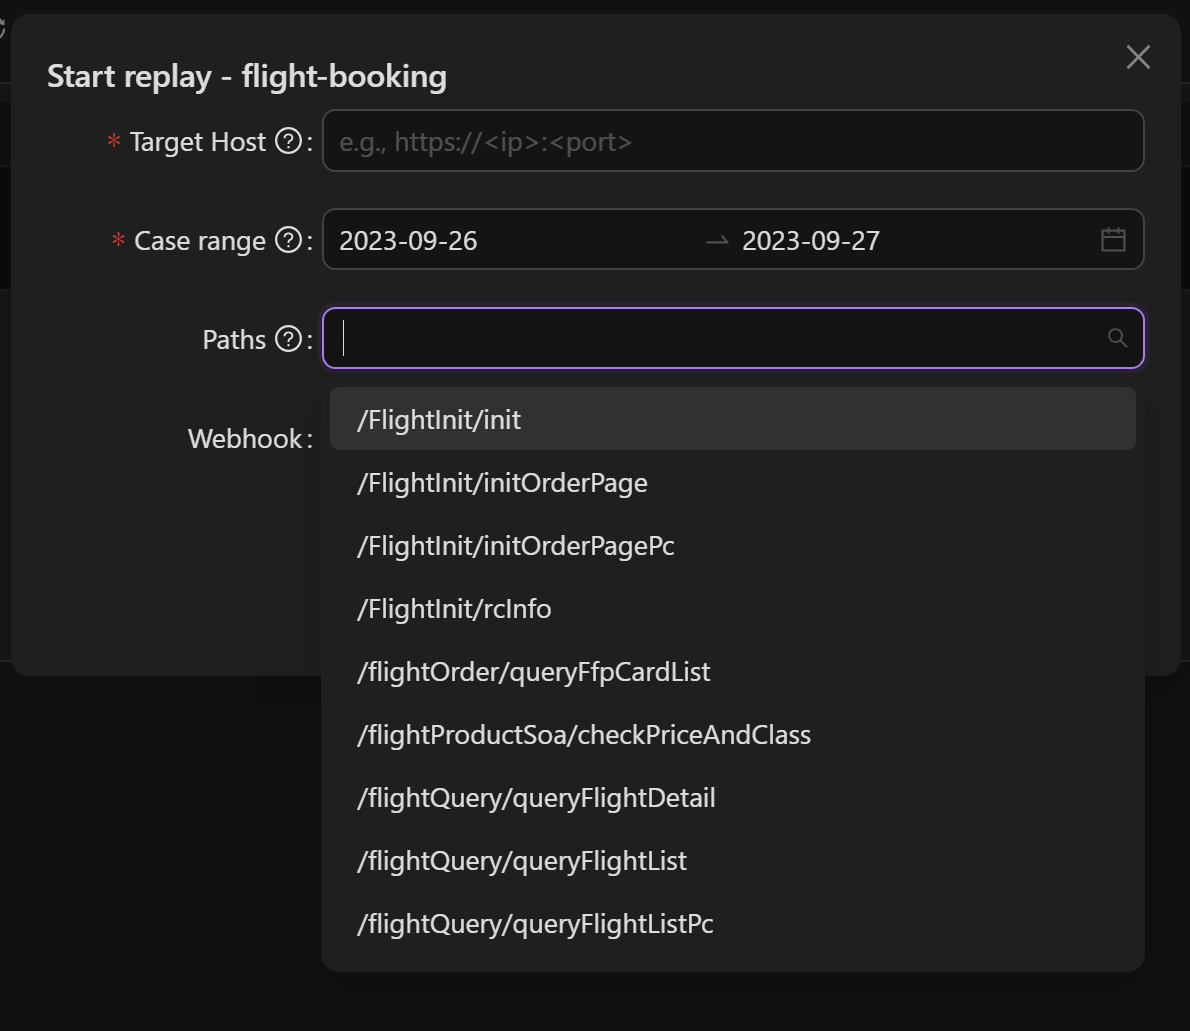
operation allows you to select the paths to be replayed in this test, if not set, all the use cases under the paths will be replayed by default.
Report overview
After running, a detailed report will displayed in the workspace.
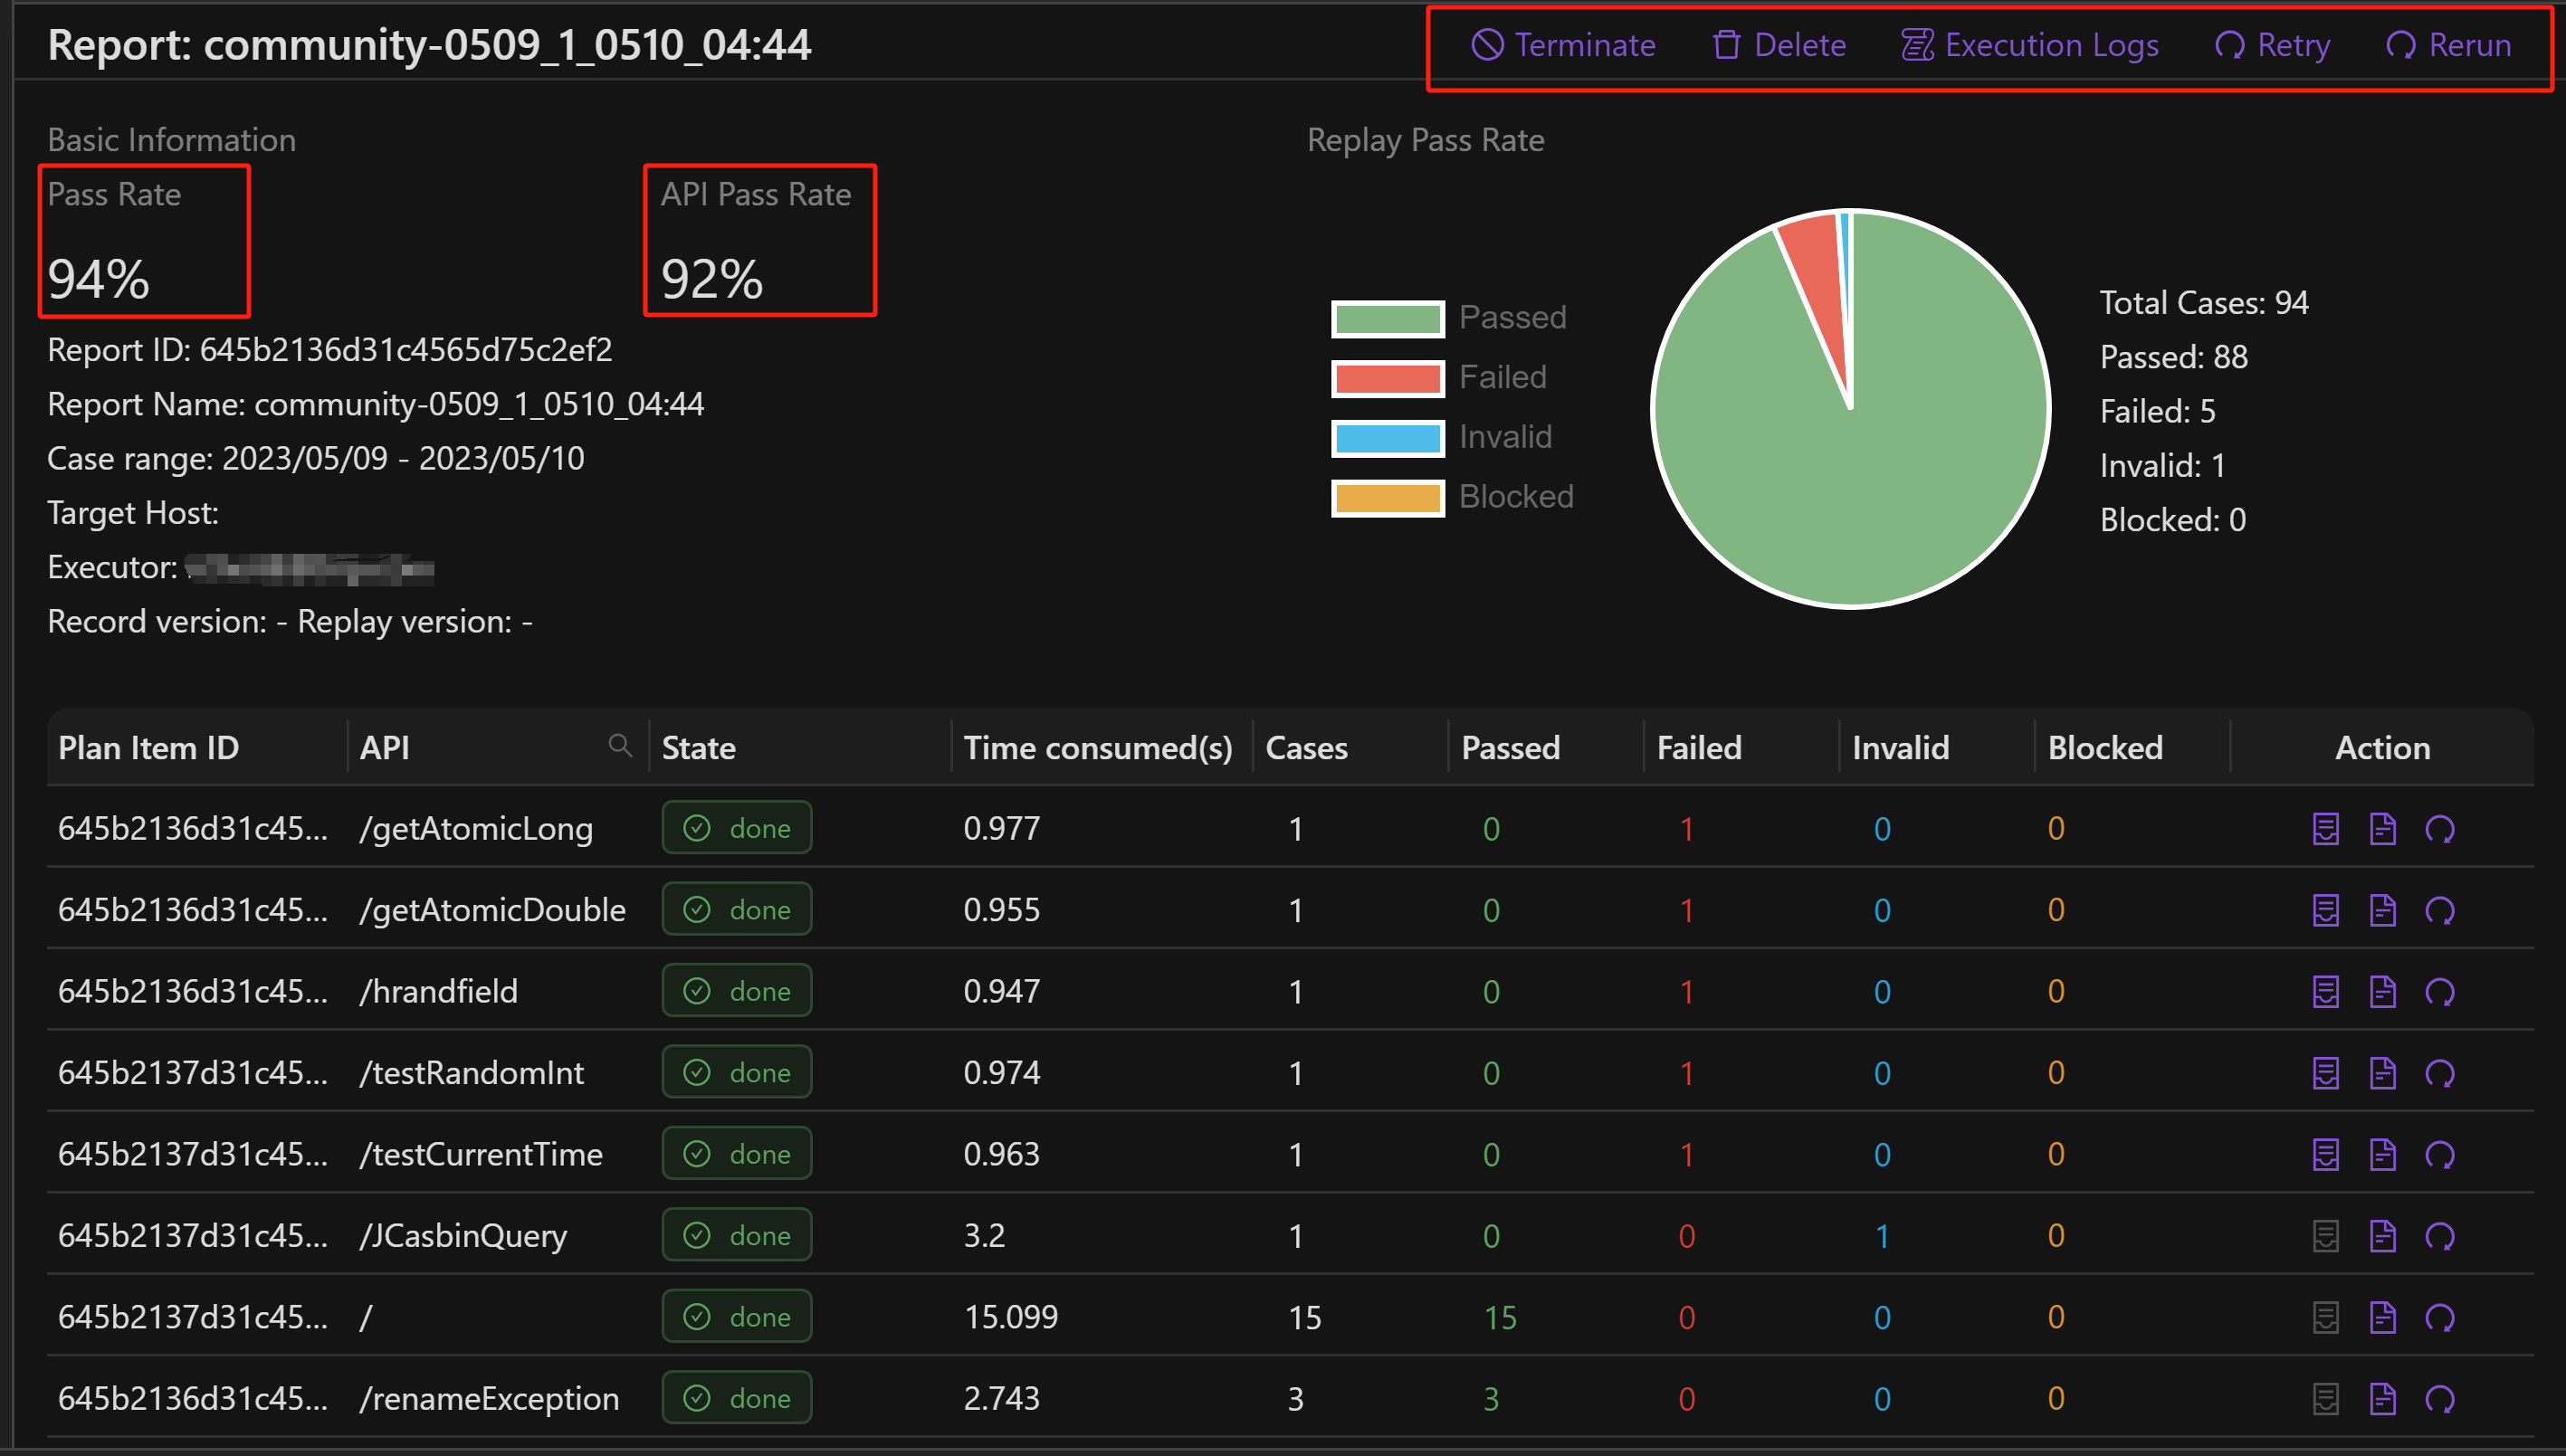
While the replay task is in progress, you can interrupt the replay by selecting Terminate at the top right of the report.
Select Delete to delete this replay report.
Select Run Again to run this replay again.
Pass Rate:Ratio of successful replayed cases to all replayed cases (A successful replayed case means no difference compared with the recorded case).
API:List of all the interfaces accessed during replay.
State:The state of replay,"running" means it's currently in progress, "done" means the replay is completed, "interrupted" means the replay was interrupted and you can select the "Run again" icon to run the test again.
Time consumed(s):Execution time of the replay test in "s".
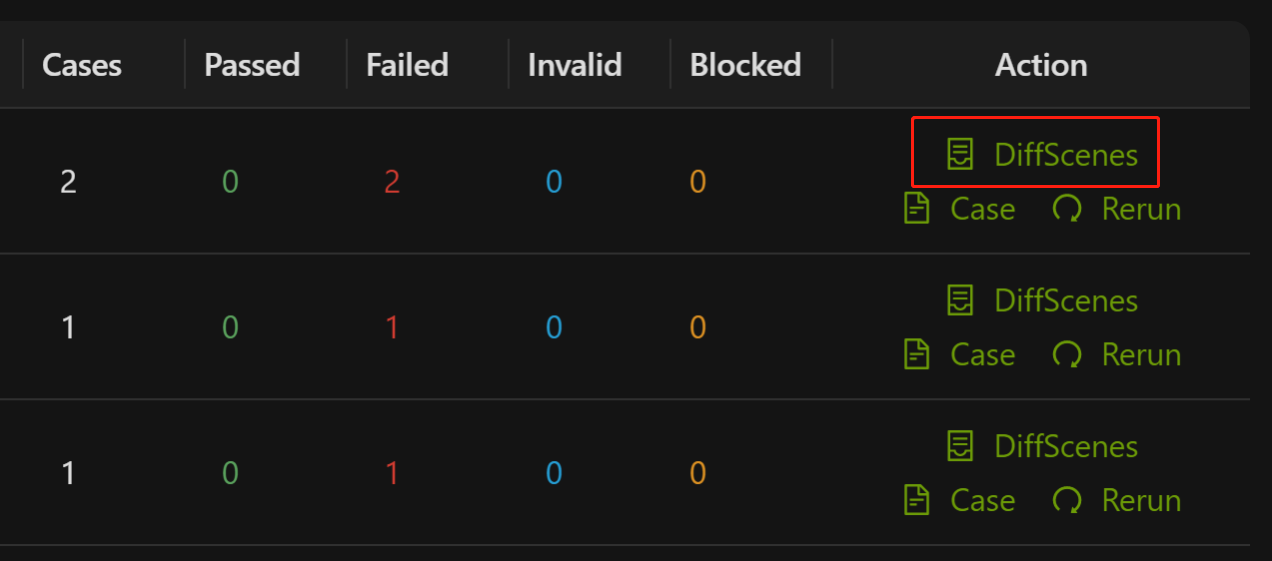
Total Cases:The number of replayed cases of this interface.
Passed、Failed、Invalid、Blocked:The number of replayed cases that passed, failed, invalid, and interrupted, respectively.
Analyze response message differences
Failed in the interface indicates that the replay response differs from the recorded one. Select DiffScenes to analyze the differences.
The replay test report provides a visual representation of the variances between the main and third-party calls during the recording and replay process. This feature allows users to easily understand and compare the differences between the recorded and replayed results. The report page presents a summary of the differences for all failed test cases and showcases a randomly selected test case for each scenario.
As shown in the diagram below, it indicates that for this particular interface, there is only one type of failure observed across all failed test cases (i.e., /posts/2-HttpClient call missing + /posts-HttpClient value diff). There are two points of differences highlighted:
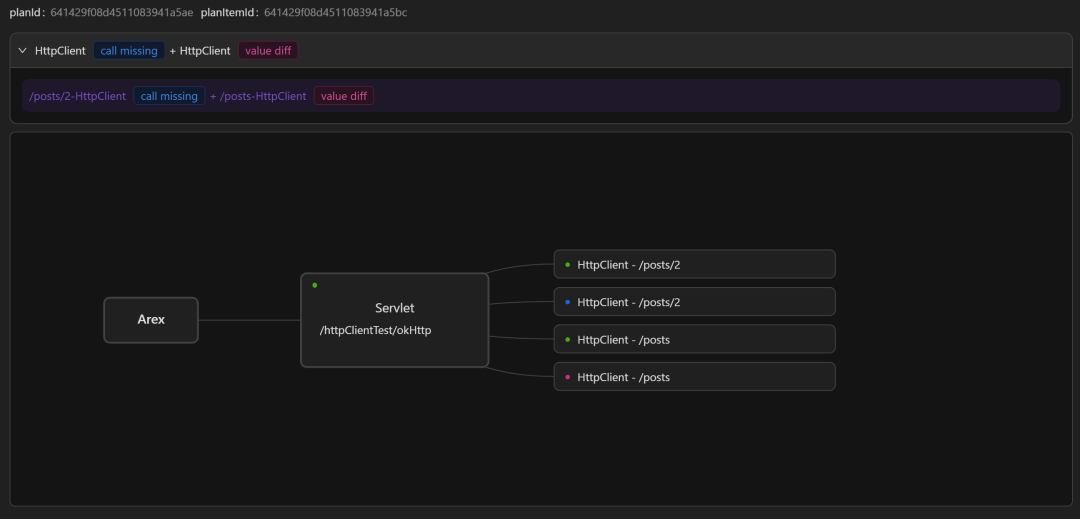
HttpClienthas a missing call to the third-party dependency/posts/2during replay, i.e. HttpClient does not make the request to/posts/2 correctly during replay.- HttpClient's call to the third-party dependency
/postsduring replay results in a value diff relative to the recorded result.
🟢 indicates that there is no difference in the comparison results, as in the example above, the return result of the main path /httpClientTest/okHttp after replay is not different from the recording.
Select the node with value diff to view the difference in response message.
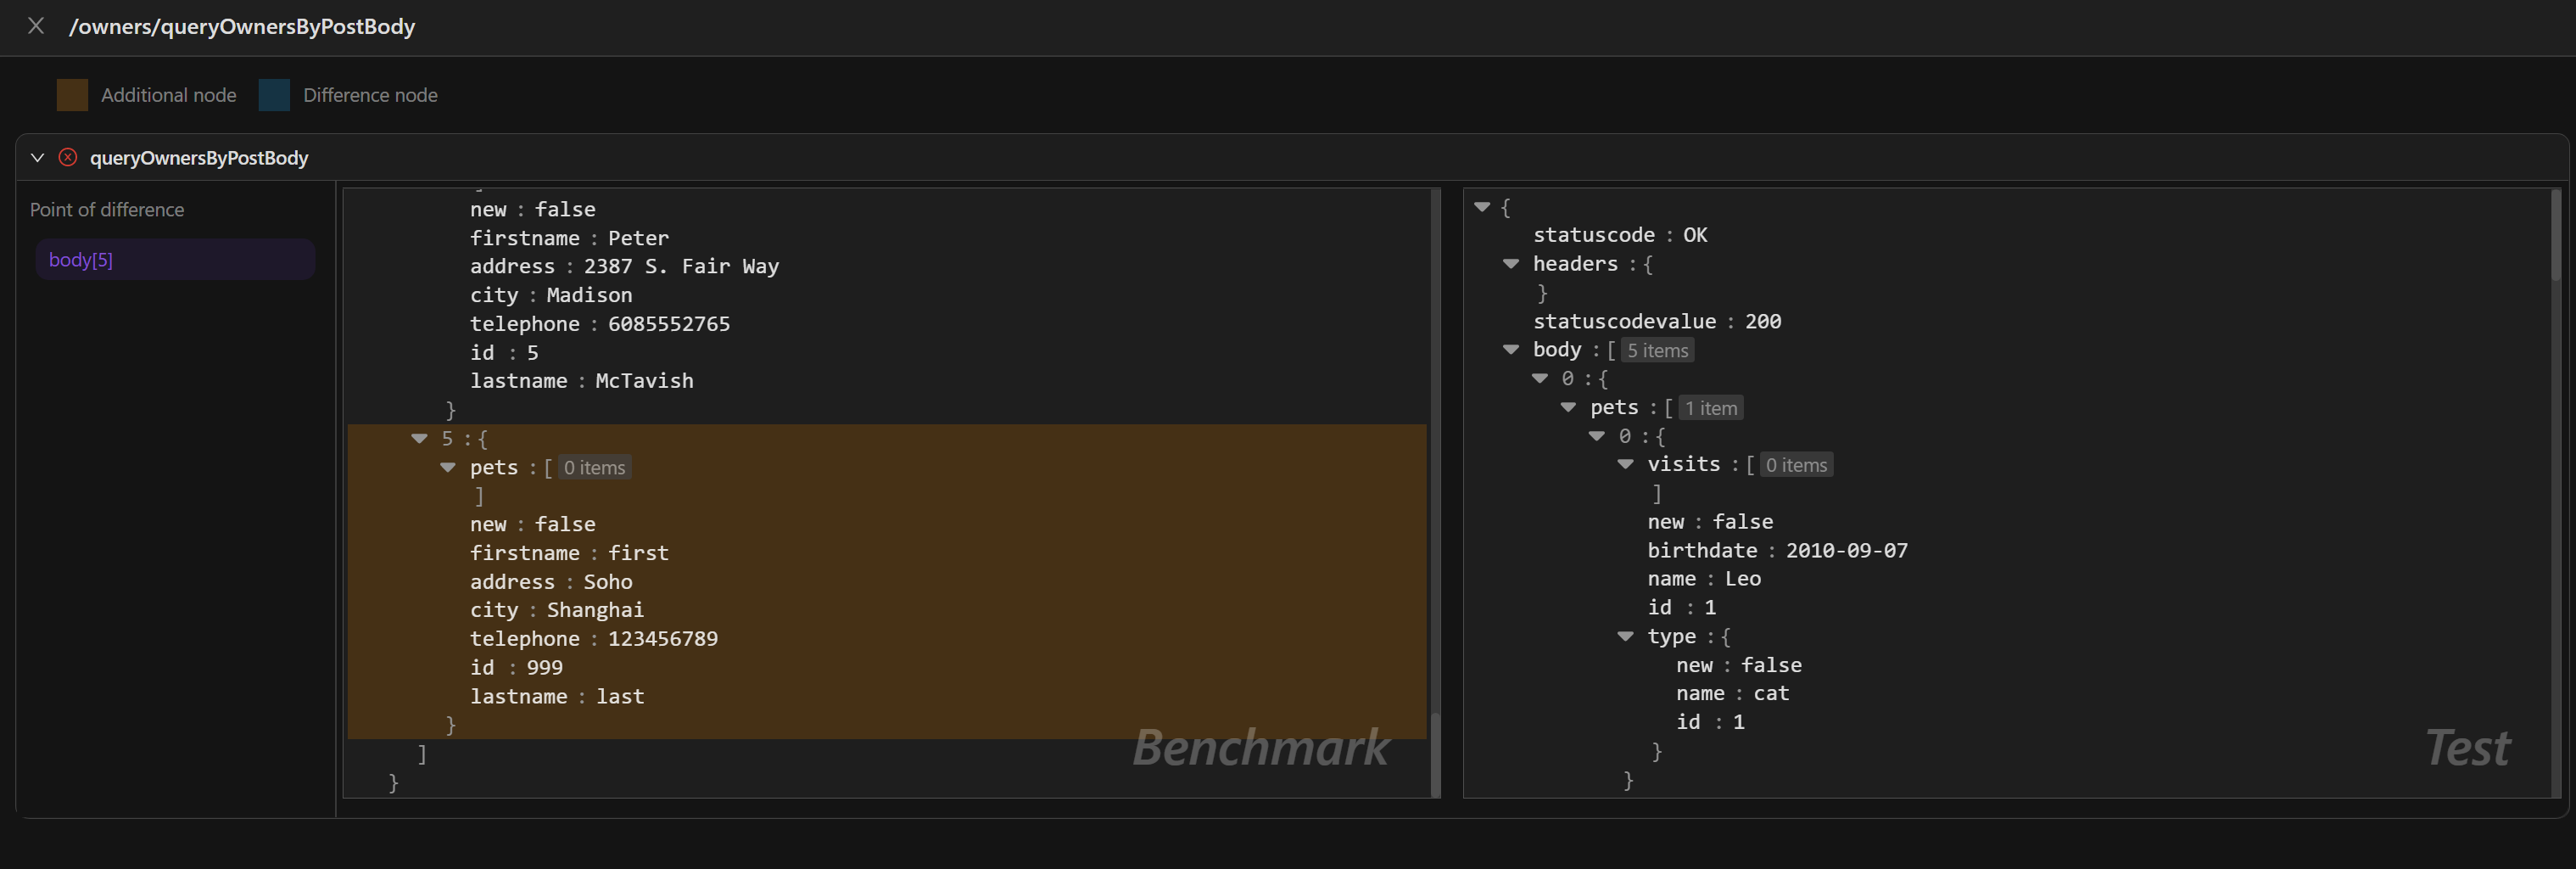
Additional node:The additional node in the return message after recording or replay. If there are any, the difference points are highlighted in orange in the message.
Difference node:Nodes that are different in the return message after recording and playback. If there are any, the difference points are highlighted in blue in the message.
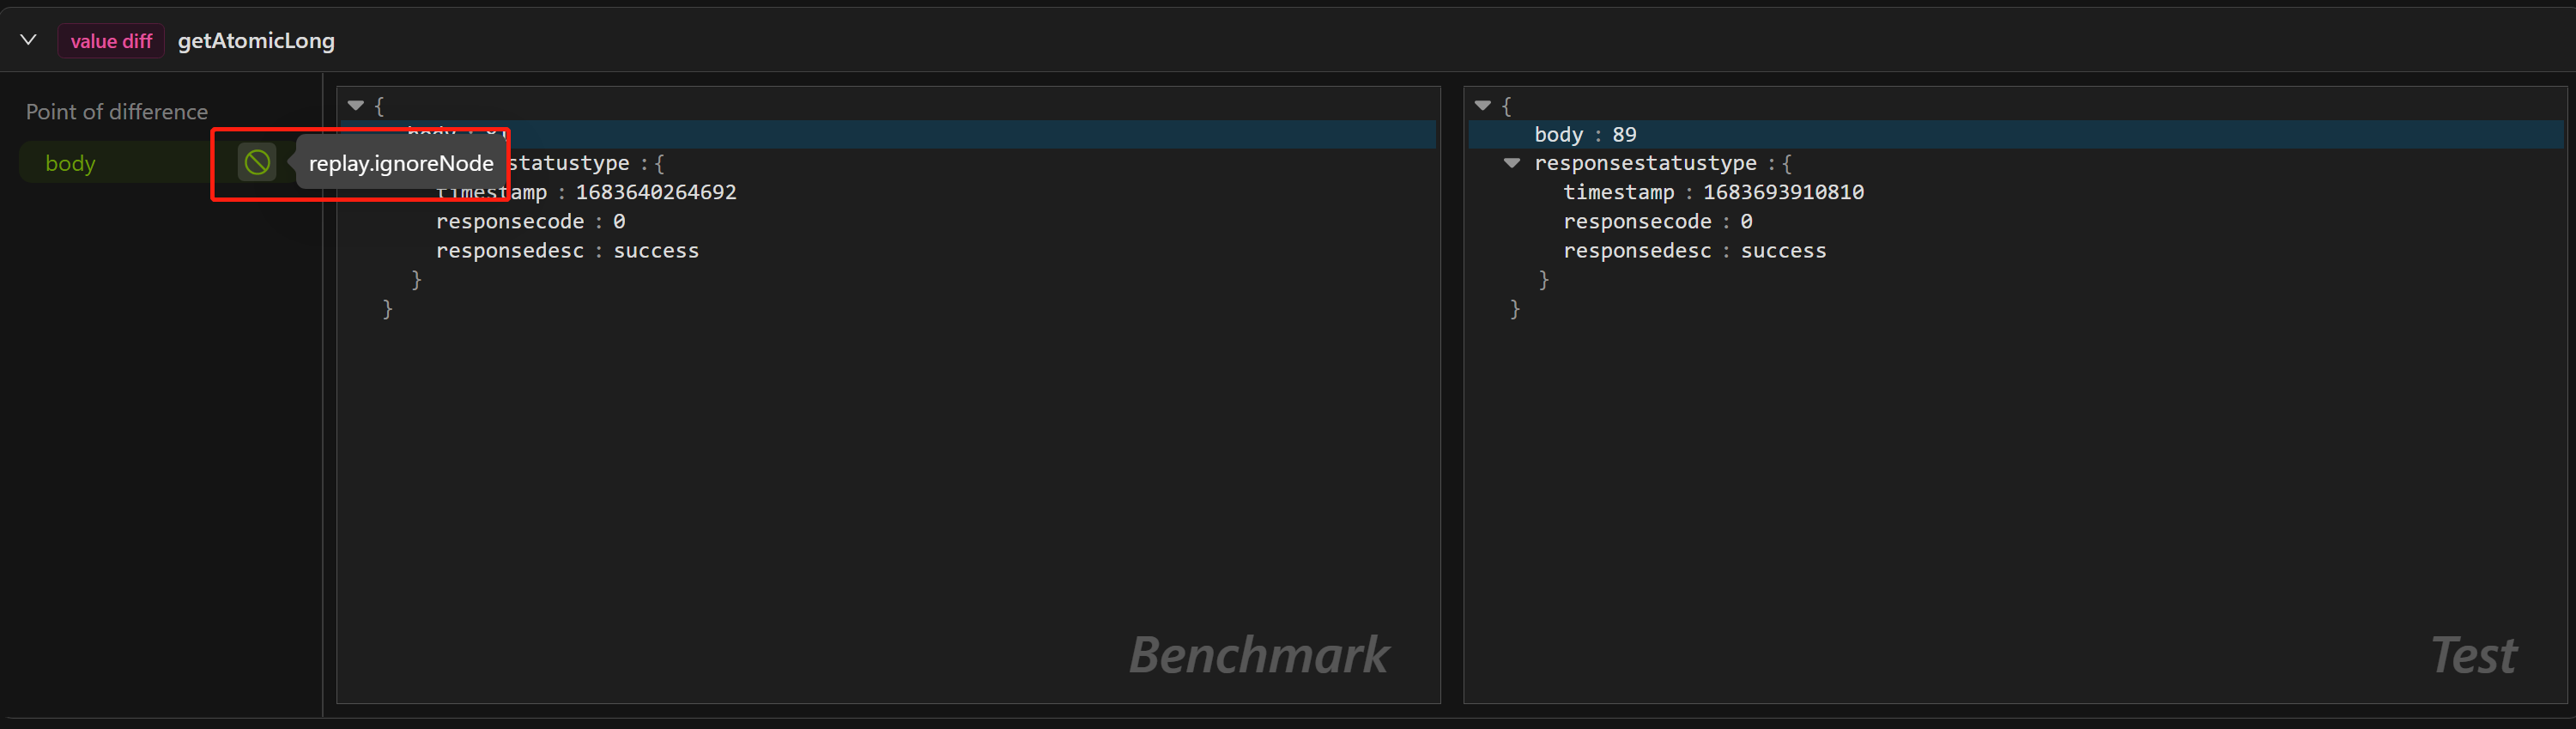
If the node is causing interference with the comparison result, you can select the button on the right side of the node to configure it for ignoring. The next replay will skip the comparison for that particular node.
Scheduled testing task
You can follow the steps below to set up a scheduled replay task:
- Click "Start replay" and enter the host address of the target service. Then it will generate an Webhook (HTTP GET request) for creating the replay. The time range for the replay case is 24 hours prior to the time of the invocation.
- After getting the Webhook, you need a tool to trigger the creation:
Take the Linux Crontab for example
Create a file named "routine" and write the following line into it:
0 5 * * * /usr/bin/curl [the copied creation address from the first step](where "0 5 * * *" is a standard Linux cron expression, indicating that the command should be executed at 5 AM every day).Run the command
crontab routineto load the scheduled task configured in the previous step.Run the command
crontab -lto check if the scheduled task has been successfully written.
Take GitLab CI/CD for example
- Set up a similar pipeline.
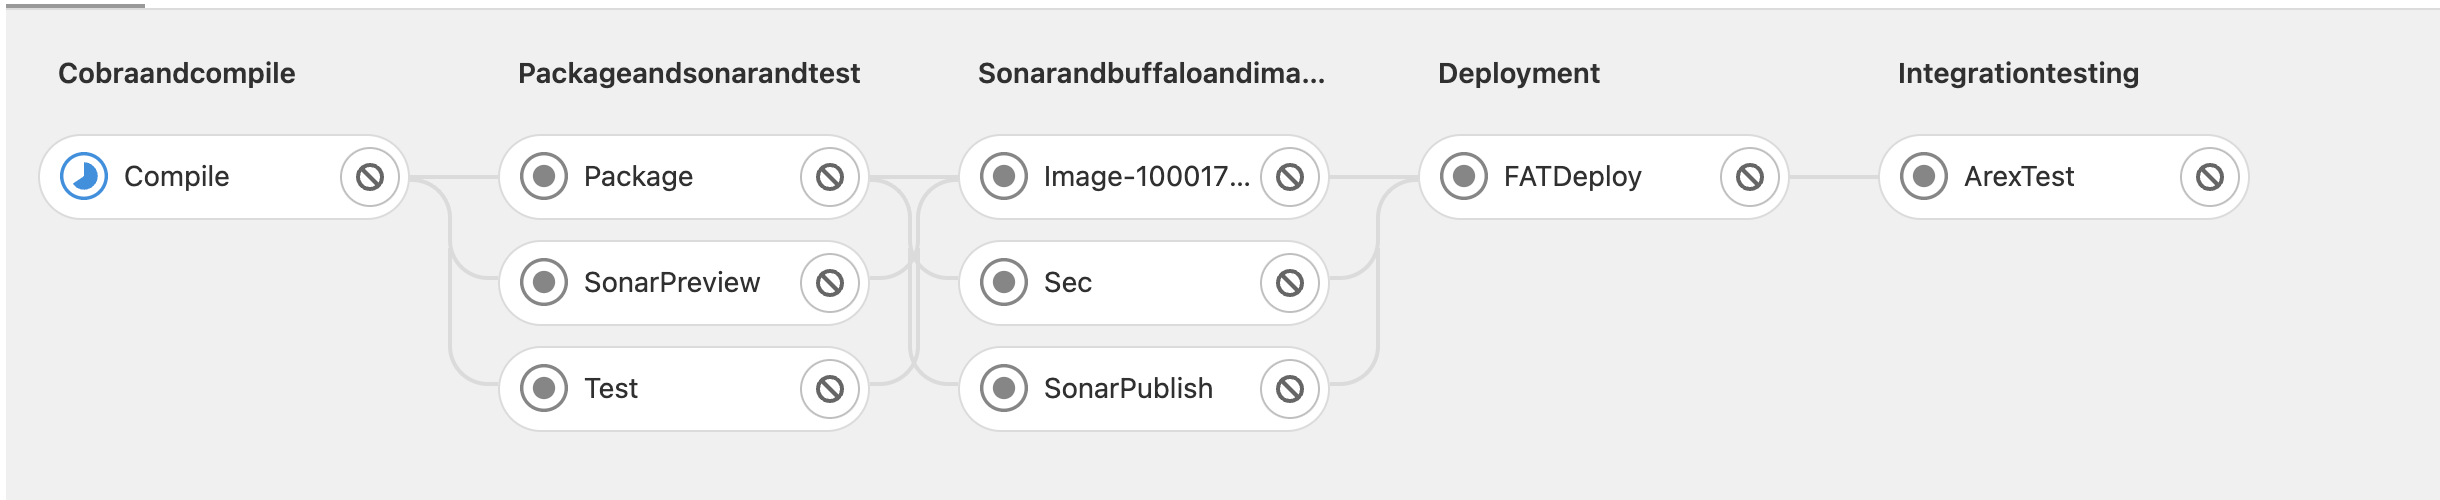
In the ArexTest Job script, use curl to call the copied link from step 1.
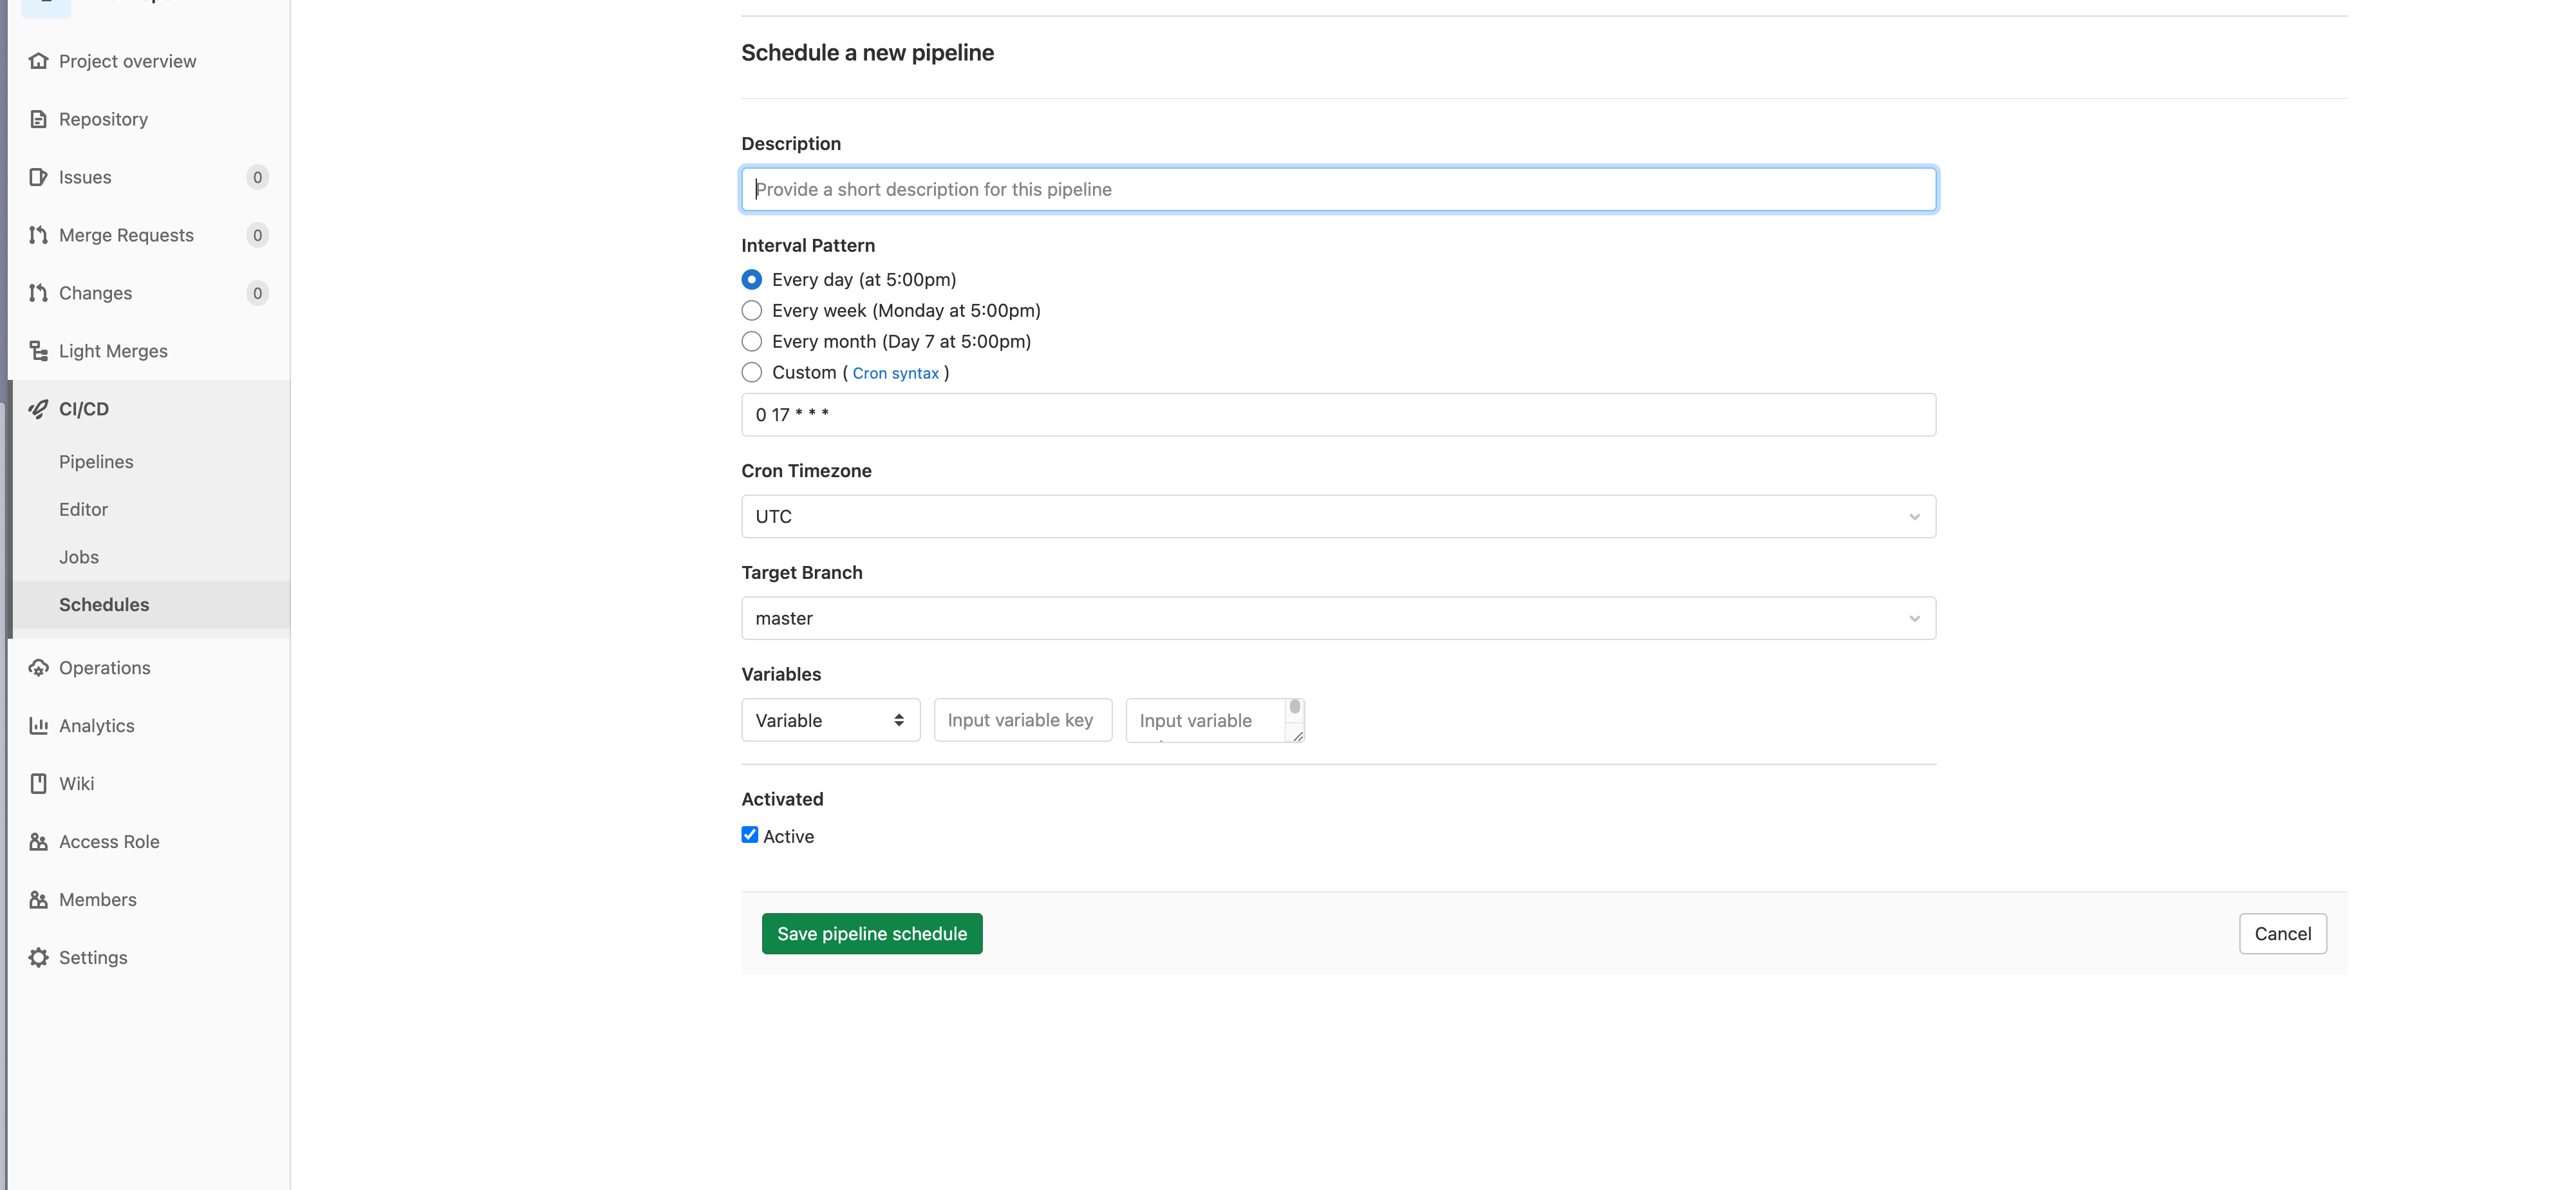
In the repository's CI/CD -> Schedules section, create a scheduled task to execute the pipeline.
Replay results callback
Replay result callback refers to the system calling the user-configured callback function interface after a replay testing, and transmitting the relevant information of the testing result to the user via a POST request. Users can process this information accordingly, such as monitoring and alerting, statistics and analysis, and triggering automated workflows.
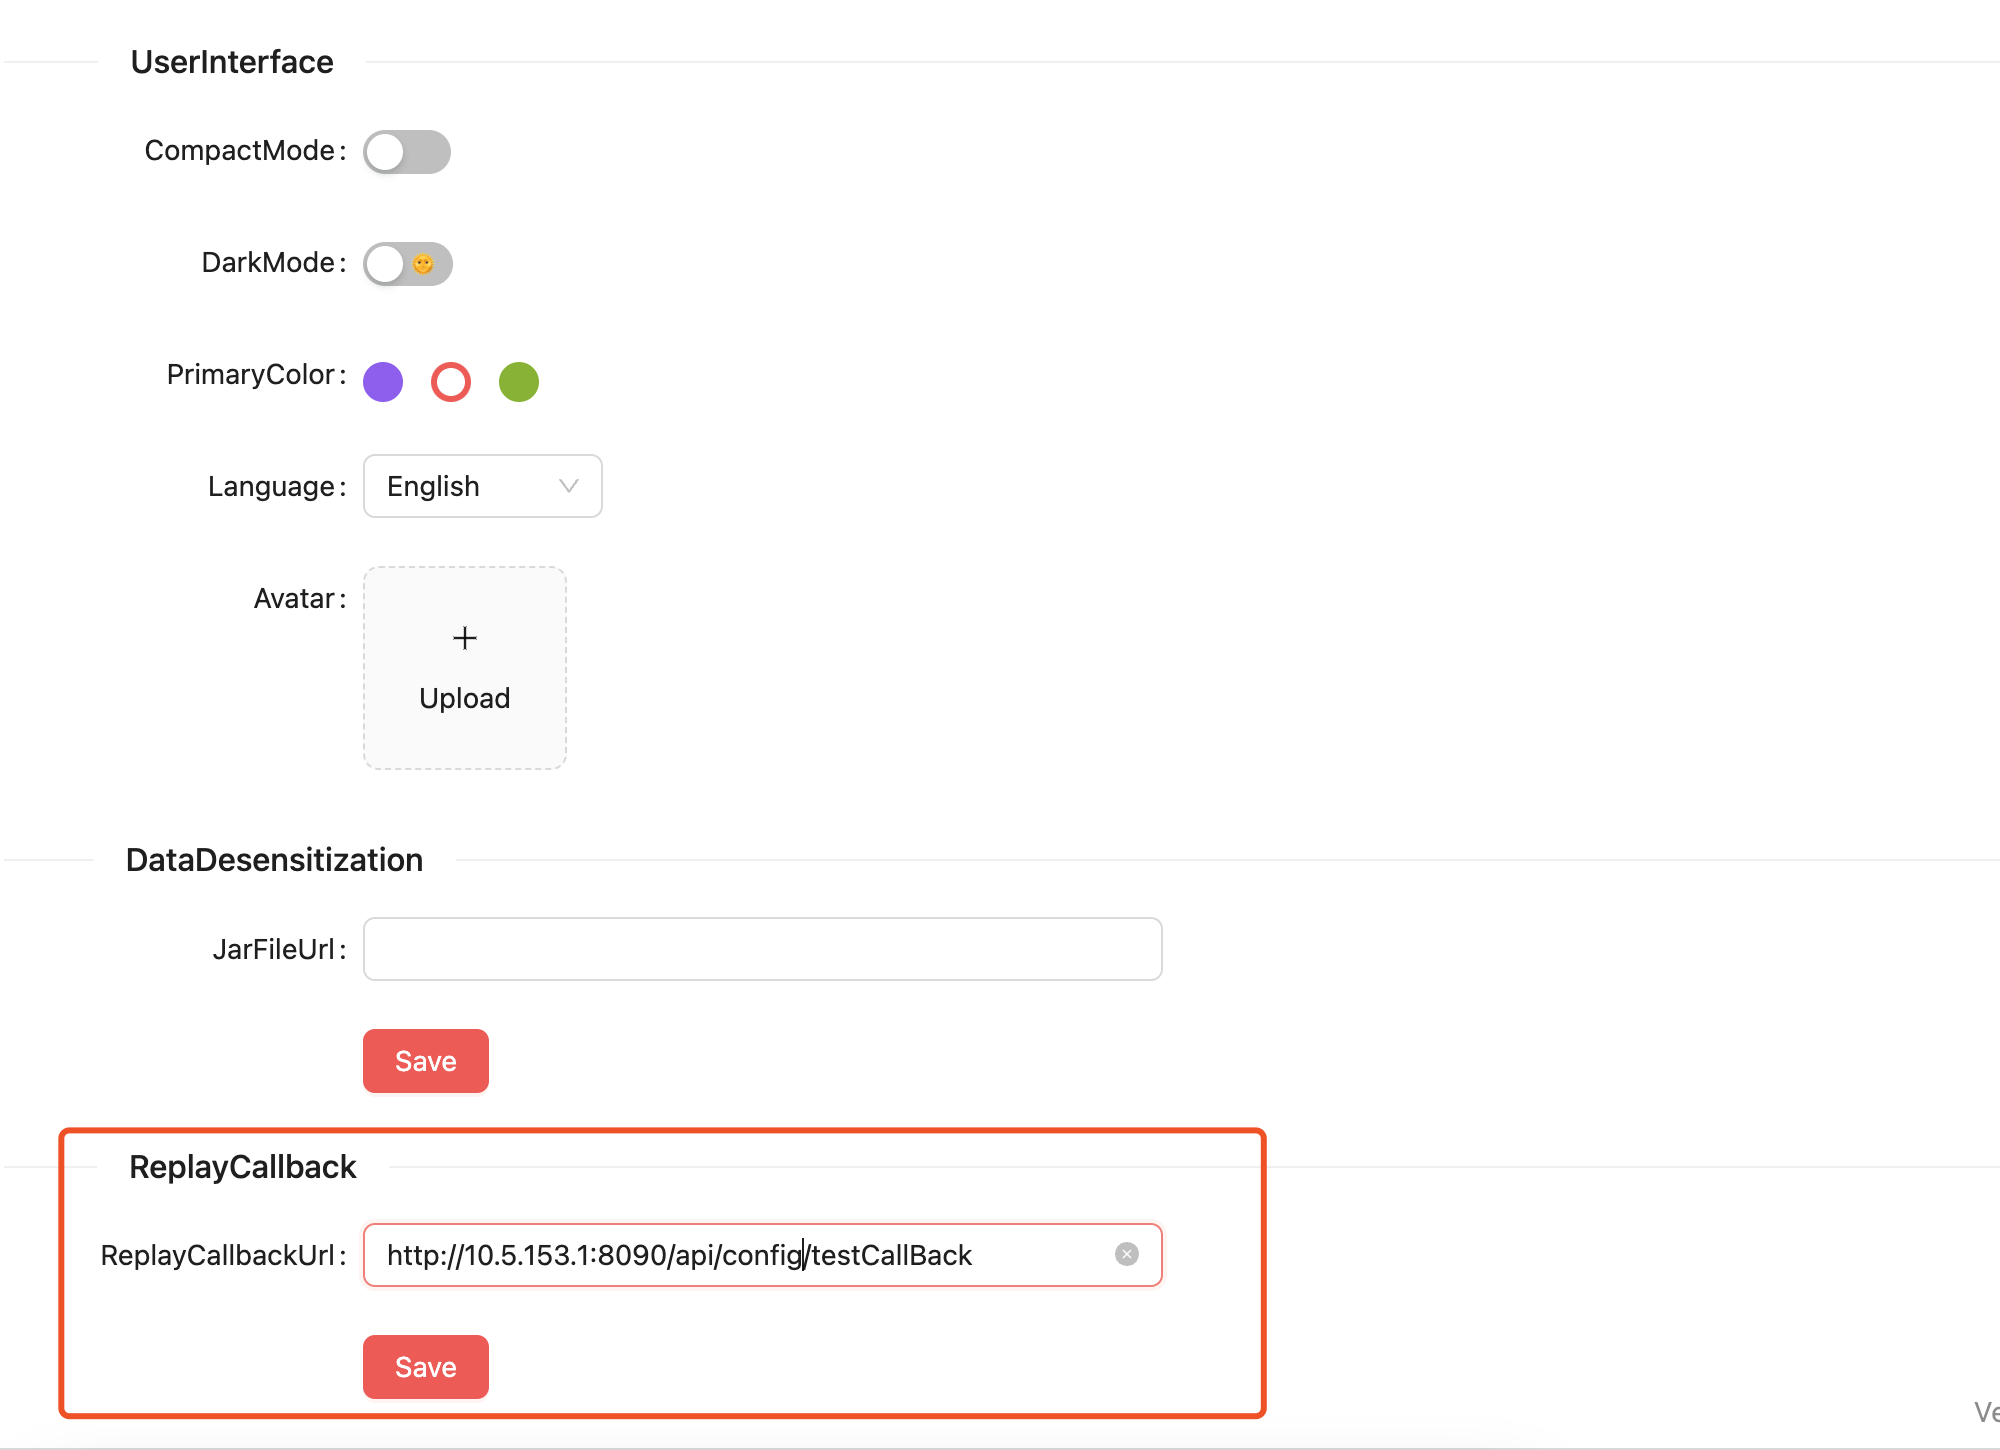
Config
Configure the ReplayCallbackUrl in the system settings. When a replay testing is done, the system will make a POST request to the URL.
Implement
To implement this functionality, you need to implement a callback function interface with the following parameters:
public class CallbackInformRequestType {

  private String appId;
  private String appName;
  private String planName;
  private Integer status;
  private Integer totalCaseCount;
  private Integer successCaseCount;
  private Integer failCaseCount;
  private Integer errorCaseCount;
  private Integer waitCaseCount;
  private Double passRate;
  private Long elapsedMillSeconds;
  private String creator;
}